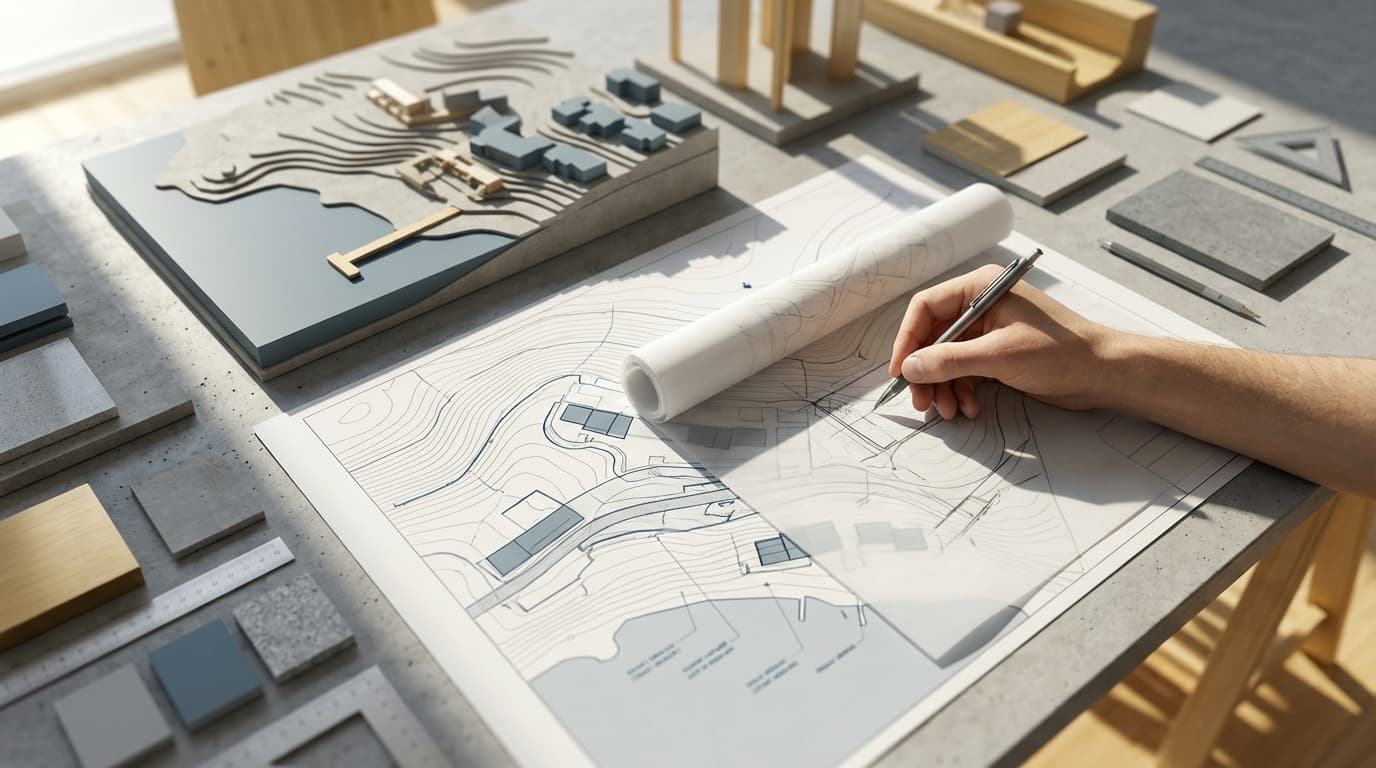
Site analysis is the most undervalued skill in architecture. Not because architects don't do it — they do — but because most treat it as a formality: a board full of annotated photographs submitted to satisfy a planning checklist, then filed and forgotten. The building that follows has no memory of the ground it stands on.
A thorough architecture site analysis is conducted during RIBA Stage 1 (Preparation and Briefing) and covers physical, environmental, planning, and contextual data before any design work begins. Done properly, it bleeds into Stage 2 — not as a document to reference, but as a live set of design constraints that actively shape every decision you make.
The difference between a building that belongs and one that just sits there is almost always traceable back to this stage. What follows is the full sequence: desk research, site visit, the seven layers you cannot skip, and — crucially — how to turn raw data into actual design moves.
Desk research should precede every site visit — it tells you what questions to ask when you get there. Arriving on site without it is like reading a novel from the middle. You'll miss the context that makes everything else legible.
OS Maps, Planning History, and What the Council Already Knows
The freely available intelligence most architects ignore is sitting on the local planning authority's portal. A planning history search takes twenty minutes and reveals refused applications, appeal decisions, and the specific objections that killed previous schemes. That's not admin — that's competitive intelligence. If three applications for a rear extension on that plot have been refused on grounds of overlooking, you need to know that before you sketch a single line.
Start with these sources before you leave the office:
Ordnance Survey maps (1:1250 for urban sites, 1:2500 for rural) — boundaries, existing structures, and the relationship to neighbouring plots
LPA planning portal — full planning history, including refused applications and appeal decisions
Historic England — listed building records, conservation area designations, and setting guidance
Environment Agency flood maps — the EA's flood map covers 100% of England and Wales and is publicly accessible; checking it takes under two minutes and can save months of abortive design work
Land Registry title plans — confirms the actual ownership boundary, which frequently differs from what the client believes
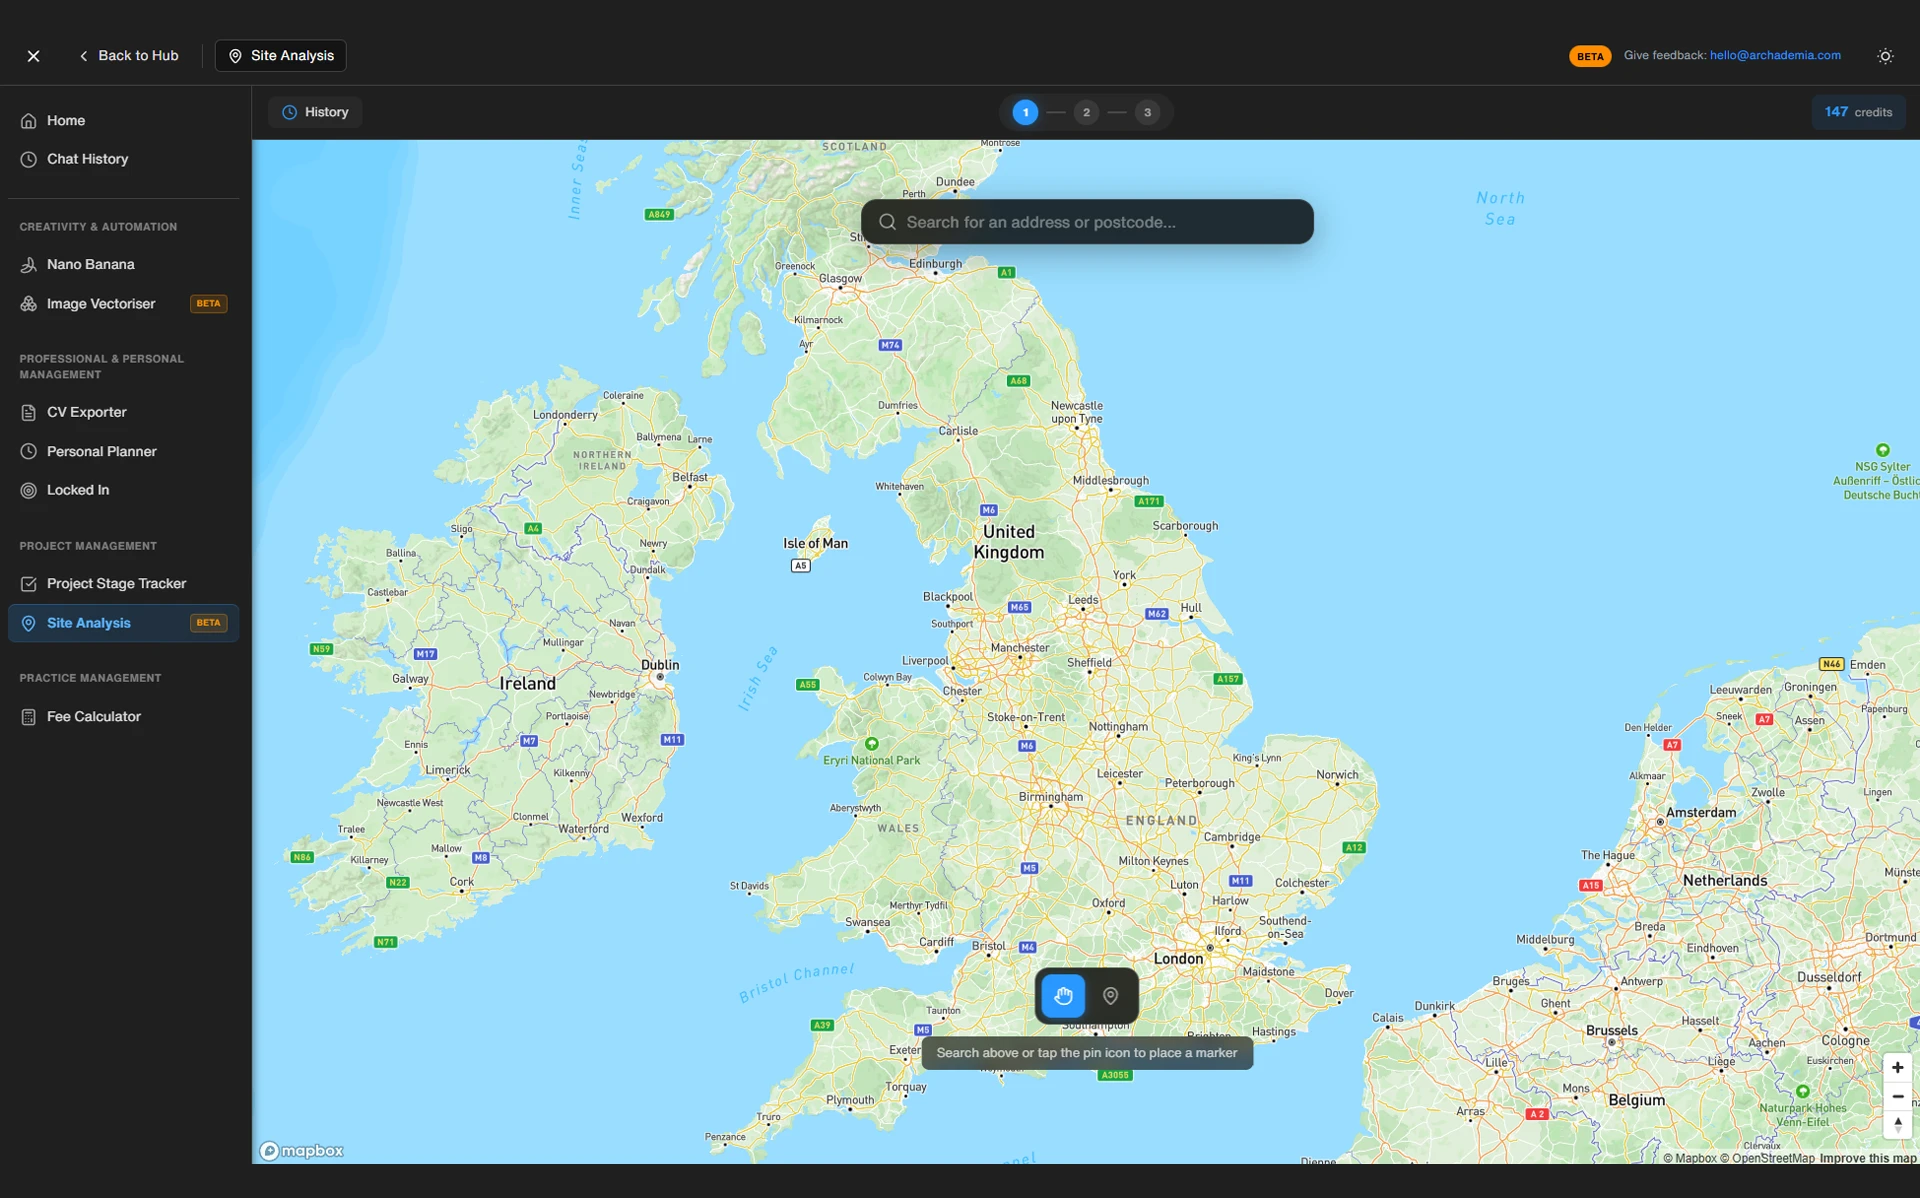
planning.data.gov.uk — Article 4 Directions, Tree Preservation Orders, and other designations in one place
Sun Path Tools and Climate Data You Can Pull Before Leaving the Office
Solar orientation is not something to assess by standing on site and squinting. The best free tool for preliminary sun path analysis on UK architecture projects is Sunearthtools.com, which provides solar angle and daylight hour data for any UK postcode without requiring software installation. For more detailed work — hourly radiation data, shadow studies across the full year — Ladybug Tools integrated with Rhino/Grasshopper provides the most comprehensive solar analysis available for UK sites, and it's free.
Check prevailing wind direction via the Met Office (typically south-westerly across most of the UK, but microclimatic variation is significant in urban settings), annual rainfall, and frost risk. This data shapes passive design strategy before you've set foot on the plot.
The goal of desk research is to pre-load your eye. You visit the site already knowing what to look for.
What to Actually Record When You're on Site
A site visit should produce three categories of record — physical measurements, environmental observations, and contextual impressions. Most architects return with forty photographs and a vague sense of the place. That's not a site analysis. That's tourism.
The Physical Survey: Boundaries, Levels, and What's Actually There
Measure the boundary dimensions yourself — don't trust the title plan alone. Note existing structures, tree positions and approximate canopy spread, and site levels. Even rough levels matter: a 1-metre level change can determine where you place the entrance, how drainage works, and whether a basement is economically viable. Mark the high and low points. Note where services enter the plot. Identify access points and visibility splays.
None of this requires a full topographic survey at Stage 1. A hand level and a measuring tape get you further than most architects admit.
The Sensory Survey: What No Map Will Ever Tell You
This is where most site analysis guides stop being useful. The physical data is necessary but insufficient. What the drawings will never tell you:
Noise sources and direction — a dual carriageway 80 metres to the north fundamentally changes where you put bedrooms
Smell — proximity to commercial extraction, waste storage, or industrial use is a material planning consideration and a quality-of-life issue
Pedestrian desire lines — where people actually walk, not where the pavement is
Overlooking — photograph neighbours' windows, not just their facades. The planning officer will ask about this. Your client will ask about this. Know the answer before anyone asks
Note the time of your visit and cloud cover. A site visited at 10am in February gives you different shadow data than a visit at 2pm in June. If you can, visit twice.
Photography That's Actually Useful
Shoot from consistent positions so the images are comparable. Always include a scale reference — a person, a ranging rod, something. Resist the urge to make the photographs beautiful; make them informative.
The best app for on-site annotation for architects is Morpholio Trace, which allows real-time sketching over photographs and immediate export of annotated site records — used by over 1 million designers worldwide. It turns your phone into a field notebook that doesn't get rained on.
Sketch on site. Even badly. A rough section through the site annotated with levels, sun angles, and key views is worth more than forty undifferentiated photographs. Before you leave, write three sentences about what the site wants to be — not what the brief says, but what the place suggests. This forces synthesis rather than mere recording, and it's the hardest part of the whole process.
The Seven Layers Every Site Analysis Must Cover
A complete architecture site analysis covers seven distinct layers — location, topography, climate, planning policy, built context, ecology, and infrastructure. Miss one and you will encounter it later, usually at the worst possible moment.
1. Location and Connectivity
Distance to transport nodes, pedestrian catchment, vehicle access. These are relevant to planning viability and to how the building will actually be used. A residential scheme with no public transport within walking distance has a different planning argument to make than one 200 metres from a train station.
2. Topography and Levels
Even a 1-metre level change can determine entrance placement, drainage strategy, and basement viability. Get spot levels at the corners and the centre of the plot at minimum.
3. Climate and Microclimate
Solar orientation, prevailing wind, rainfall, and overshadowing from adjacent buildings. This layer directly drives passive design strategy — window placement, shading devices, natural ventilation routes. It cannot be retrofitted at Stage 3.
4. Planning and Policy
The Local Plan, design guides, conservation area appraisals, any applicable Neighbourhood Plan. These set the outer limits of what's possible before you've drawn anything. Read the relevant policies, not just the summary.
5. Built Context and Character
Building lines, plot ratios, predominant materials, roof forms, window proportions. This is the visual grammar of the place — the thing a planning officer means when they say your proposal is 'out of character', and the thing you need to understand well enough to either follow or consciously break.
6. Ecology and Landscape
Existing trees must be assessed against BS 5837 if any are significant — the survey determines root protection areas that constrain your footprint. Biodiversity Net Gain of at least 10% is now mandatory for most new developments in England as of 2024, making ecology assessment a non-negotiable part of any site analysis conducted in 2026. A Phase 1 Habitat Survey may be required before planning can be validated.
7. Infrastructure and Services
Drainage (combined or separate sewer?), electricity supply capacity, gas, telecoms. These affect programme and cost before a line is drawn. A site with no gas connection, inadequate electrical capacity, and a combined sewer at capacity is a fundamentally different design problem than one with full services at the boundary.
Comparison Table: Site Analysis Layers at a Glance
The seven layers of an architecture site analysis each have distinct sources and direct design implications — the table below maps them in full.
Layer
What to Record
Where to Find It
Design Implication
LayerLocation & Connectivity
What to RecordTransport links, pedestrian routes, vehicle access
Where to Find ItGoogle Maps, OS maps, local transport authority
Design ImplicationEntrance placement, parking strategy, building use viability
LayerTopography & Levels
What to RecordContours, spot levels, drainage fall
Where to Find ItOS 1:1250 maps, site visit with hand level
How to Turn Data Into Design — Not Just a Pretty Board
Site analysis only earns its keep when it generates design decisions — the synthesis diagram is the tool that makes this happen. Everything before this point is research. This is where architecture starts.
The Synthesis Diagram: One Drawing That Earns Its Place
Most site analysis presentations are beautiful and useless. They show what was found but not what it means. A board full of annotated aerial photographs and climate roses tells the client you've been thorough. It tells the planning officer you've done your homework. It tells neither of them what you're going to do about it.
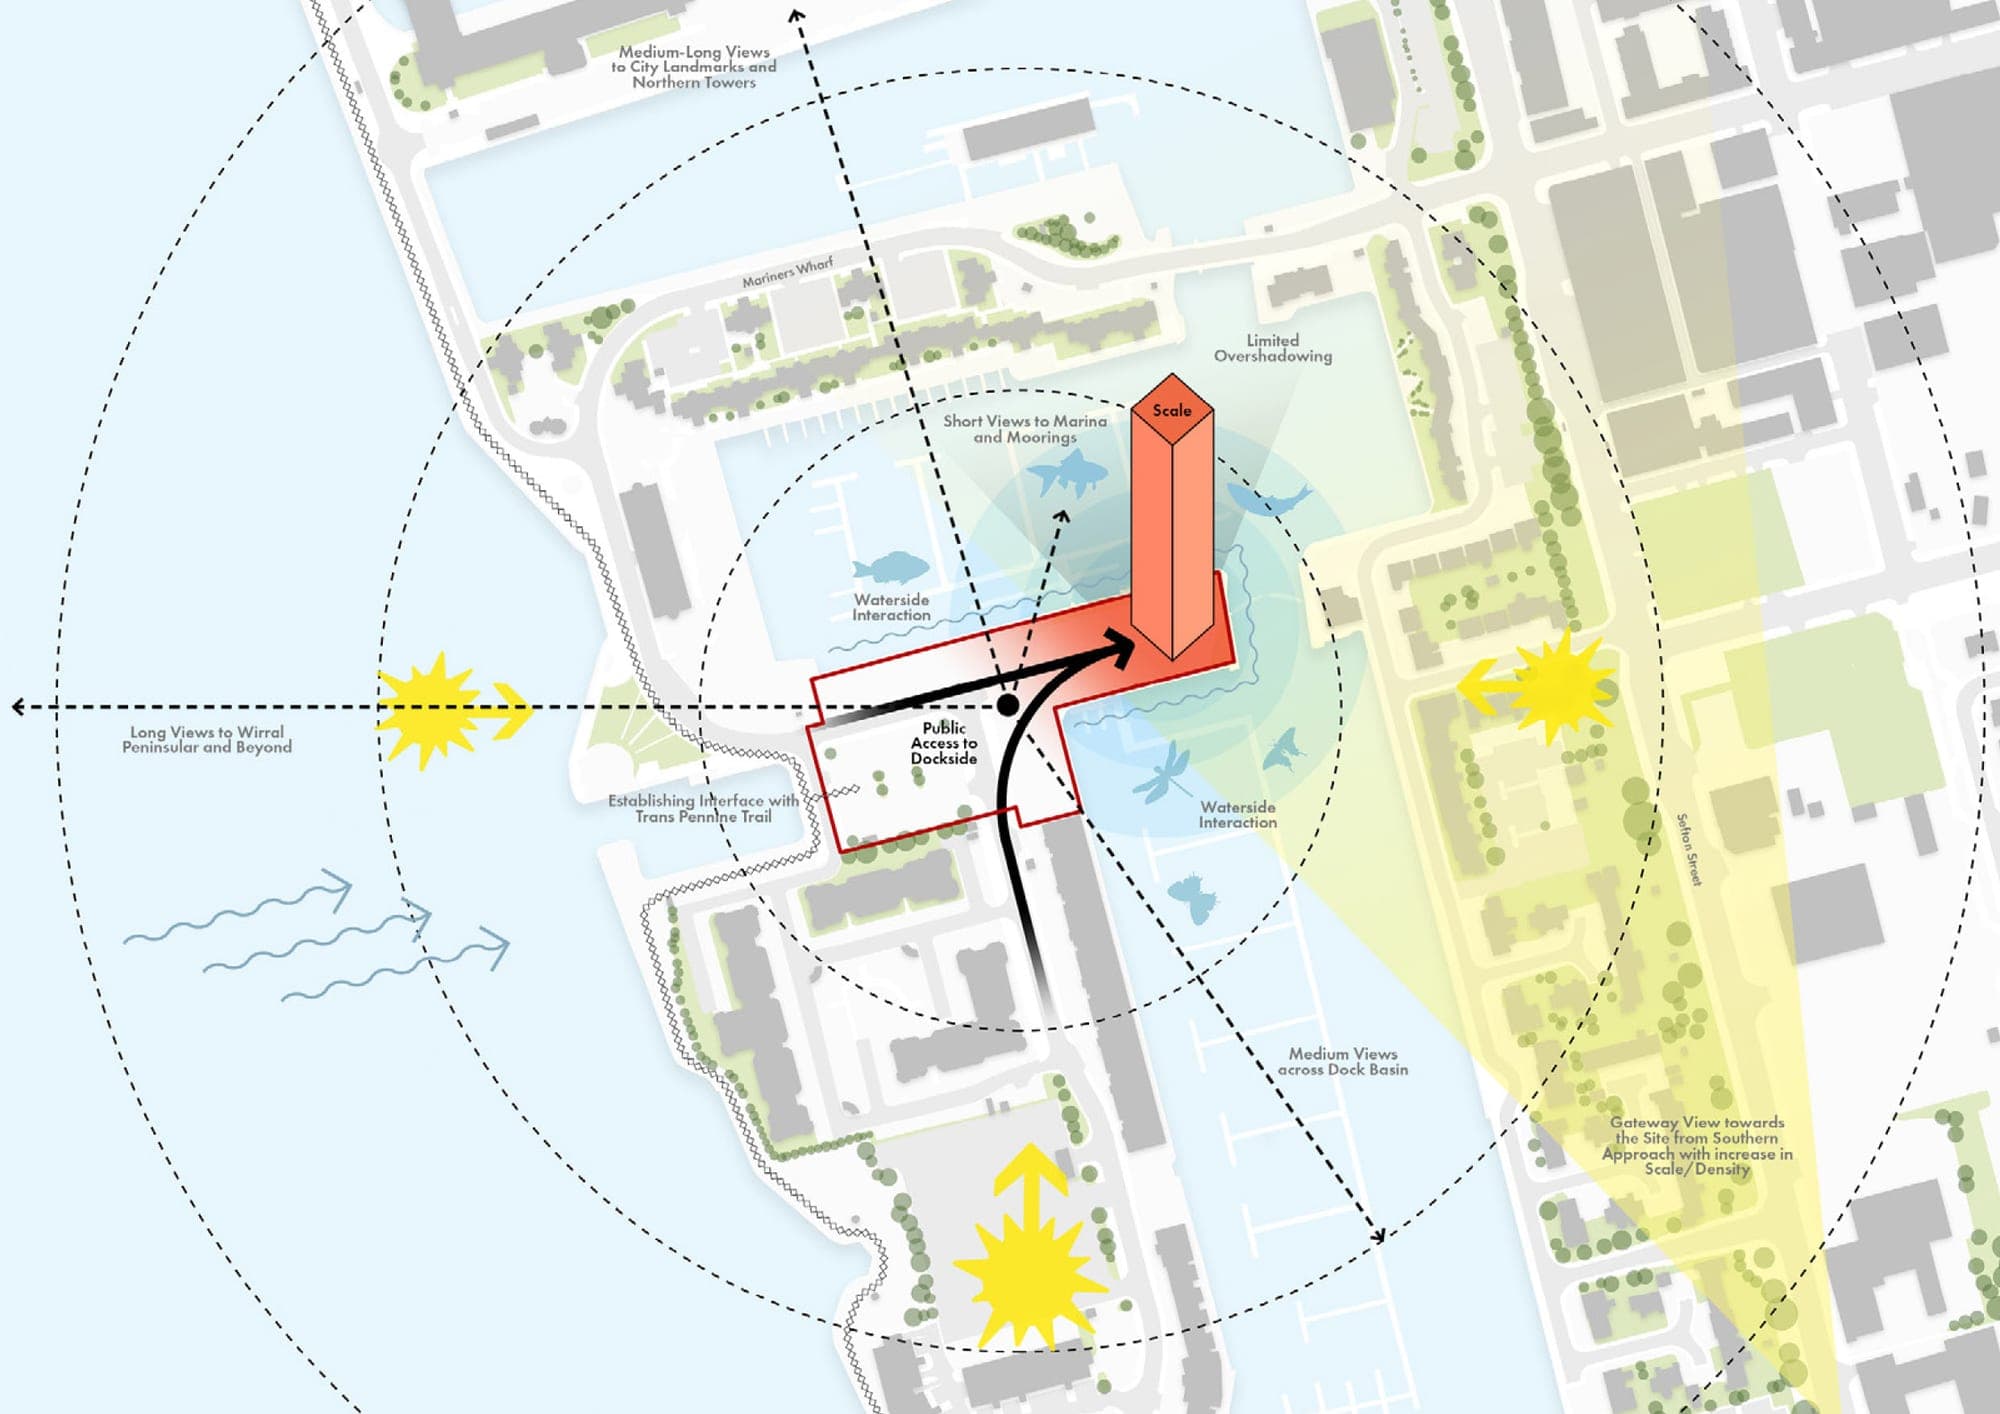
The synthesis diagram is different. It overlays the most significant findings onto a single site plan: primary views worth capturing, solar orientation, prevailing wind direction, key constraints (the TPO'd oak, the overlooking window to the north, the acoustic buffer needed from the road), and proposed access. This drawing becomes the first genuine design move of the project — the moment analysis tips into architecture.
A site analysis synthesis diagram overlays the most critical findings — solar orientation, prevailing wind, key views, access points, and constraints — onto a single site plan, and represents the first genuine design move of any project.
Constraints vs Opportunities: The Framing That Changes Everything
The most effective method for translating site analysis into design is the constraints-versus-opportunities framework, which reframes every limitation as a potential generator of architectural form or programme.
A south-facing slope is not a drainage problem. It's a passive solar opportunity and a reason to step the section. A noisy road to the north is not a nuisance. It's a reason to orient living spaces southward and use ancillary programme — garage, utility, entrance sequence — as an acoustic buffer. A TPO'd oak that can't be touched is not a constraint on the footprint. It's the centrepiece of the garden design and the thing that gives the house its character.
Every constraint is also a design generator. The architects who understand this produce buildings that feel inevitable — like the site could only ever have produced that building. The architects who don't produce buildings that apologise for existing.
For a deeper look at how this plays out from concept through to planning submission, ArchAdemia's architectural design course works through the full design process with real project examples.
Write a site brief in 100 words before you start designing. Not the client's brief — the site's brief. What is the place asking for in terms of massing, orientation, access, and character? This is the bridge between analysis and concept, and it's the step most architects skip entirely.
Presenting Site Analysis: What Clients and Planners Actually Need to See
Site analysis presentations should be tailored to the audience. A client needs to understand viability and vision. A planning officer needs to see that you understand the context. These are different documents with different emphases — and conflating them is a common mistake.
For Clients: Viability and Vision
Clients are not reading your site analysis for its analytical rigour. They want to know: can we build what we want here, and what are the constraints we need to understand? Lead with the planning history and any red flags. Explain what the flood risk, the TPOs, or the conservation area designation means for their project in plain terms. Then show the opportunities — the south-facing garden, the view to the church tower, the quiet street frontage.
Keep it visual. A well-annotated aerial photograph communicates more to a client than three pages of policy references.
For Planners: Context and Compliance
Planning officers are looking for evidence that you understand the site in its context. The design and access statement that accompanies a planning application is where site analysis findings are formally presented — and it's where most architects undersell themselves. Show the analysis. Show the response. Draw the explicit line between what you found on site and why you made the design decisions you made.
The best planning applications read like a logical argument: here is what the site is, here is what the policy framework requires, here is how the design responds to both. Site analysis is the opening premise of that argument.
Frequently Asked Questions
What is a site analysis in architecture?
A site analysis in architecture is a structured assessment of a site's physical, environmental, planning, and contextual characteristics conducted before design work begins. It covers factors including topography, solar orientation, planning policy, built context, ecology, and infrastructure — and its purpose is to generate design decisions, not simply document conditions.
When should a site analysis be carried out?
Site analysis is formally located within RIBA Stage 1 (Preparation and Briefing) but should continue to inform work through Stage 2 (Concept Design). The desk research phase should be completed before the first site visit, and the synthesis diagram — which translates findings into design moves — should be produced before any massing work begins.
What should a site analysis include?
A complete architecture site analysis should include desk research (OS maps, planning history, flood risk, heritage designations), a physical site survey (boundaries, levels, trees, services), environmental observations (solar path, wind, shadow), sensory data (noise, overlooking, desire lines), and a synthesis diagram that overlays key findings onto a site plan.
What is the best tool for sun path analysis on UK architecture projects?
The best free tool for preliminary sun path analysis on UK projects is Sunearthtools.com, which provides solar angle and daylight data for any UK postcode without software installation. For detailed analysis — including hourly radiation data and annual shadow studies — Ladybug Tools integrated with Rhino/Grasshopper is the most capable option available to architects in 2026.
Is Biodiversity Net Gain mandatory in 2026?
Yes. Biodiversity Net Gain of at least 10% is mandatory for most new developments in England under regulations that came into full effect in 2024. A biodiversity baseline assessment must be completed before design begins, making ecology a non-negotiable layer of any site analysis for projects in England.
What is a synthesis diagram in site analysis?
A synthesis diagram is a single drawing — typically a site plan — that overlays the most significant findings from a site analysis: solar orientation, prevailing wind, key views, access points, noise sources, and major constraints. It is the tool that translates raw site data into the first design moves of a project, and it is the step that separates a useful site analysis from a decorative one.
How is a site analysis presented to a planning authority?
Site analysis findings are formally presented through the Design and Access Statement that accompanies a planning application. The statement should draw an explicit line between the site conditions identified (context, policy, ecology) and the design decisions made in response — demonstrating that the scheme is a reasoned response to its specific location, not a generic solution dropped onto a plot.
What is the difference between a site survey and a site analysis?
A site survey records measurable physical data — boundaries, levels, existing structures, tree positions. A site analysis interprets that data alongside environmental, planning, and contextual information to generate design intelligence. A survey tells you what is there. An analysis tells you what it means for the building you're about to design.
Site analysis is not a stage you complete and move on from. It's the argument your building makes for the rest of its life — the reason it sits where it sits, faces the direction it faces, and responds to its neighbours the way it does. Get it right and every subsequent design decision has a foundation. Get it wrong and you're building on sand, hoping no one notices.
They always notice.
If you want to understand how site analysis feeds directly into concept development and design decision-making, ArchAdemia's architectural design course works through exactly this sequence — from first site visit to planning submission — with the kind of practical detail that studio education tends to skip.